
Goal
Hands-on practice for the work with matrices (np.array), and with the generation of simple plots
using matplotlib.pyplot.
Additional Information
Here you can find additional information on ...
- Plotting with Matplotlib (from Scientific Python Lectures)
- Numerical operations on arrays (from Scientific Python Lectures)
- SAPy, chapters:
- 1.2.2. Mathematical Basics
- 2.2.3. Numpy Vectors and Arrays
- 4. Data Display
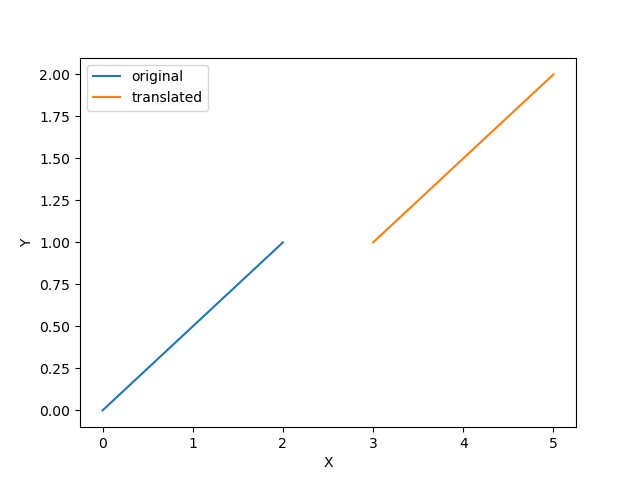
Translating Data
Write a Python script that:- specifies two points,
P_0 = [0, 0]andP_1 = [2, 1]. Each point should be expressed as a Pythonlist([a,b]) - combines these two points to a
np.array, - shifts those data, by adding
3to the first coordinate, and1to the second, - plots a line from the original
P_0to the originalP_1, and on the same figure also plots a line between the shifted values.
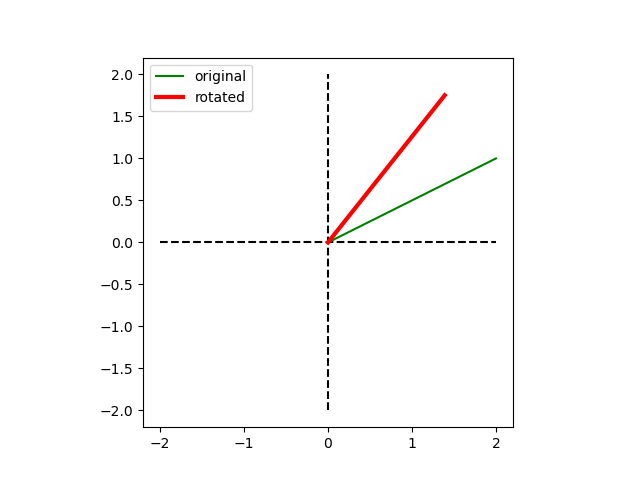
Rotating a Vector
Write a Python script that specifies two points,P_0 = [0, 0] and
P_1 = [2, 1], and calculates the vector
from P_0 to P_1.
Then write a Python-function that:
- takes a vector and an angle as input parameters,
- rotates the vector by 25 degrees,
- and returns the rotated vector.
			R = np.array([[np.cos(alpha), -np.sin(alpha)],
				      [np.sin(alpha),  np.cos(alpha)]])
If you want to experiment a bit with plots, you can try to
- plot a green line from
P_0toP_1, - superpose this plot with a coordinate system, from -2 to +2,
- superpose the rotated line in red, with increased
line-thickness. (You can modify the width of a line with the
plotparameterlinewidth=...)
Solution
Written by Thomas Haslwanter at fh-ooe.at, July-2024
Visit us at:
University of Applied Sciences, Dept. Med. Engineering
4020 Linz, Austria
Visit us at:
University of Applied Sciences, Dept. Med. Engineering
4020 Linz, Austria