Goal
Demonstration of a real world data analysis problem - and the corresponding solution!Full Example: Gait-Analysis
Get the data
- Import the data from the file gait.pickle, which have been saved
in a "pickeled" format, with the command
with open('gait.pickle', 'rb') as fh_input:
    gait = pickle.load(fh_input)
The data are stored in a Pythondictionary, and contain the keys['time', 'knee_angle', 'heel_strike', 'info']. They contain the knee angle of the right knee, of a healthy male subject who walked for 35 sec on a treadmill. - Print the
infostring. - Inspect the data.

Calculate mean and variablity for the gait-cycle
A "gait-cycle" is the time from one heel-strike to the next heel-strike. Since some steps are a little bit shorter, and some a little bit longer, the duration of the steps varies. To determine mean and variability for a "typical" step, all the steps have to be brought onto the same length. This can be achieved with "interpolation" of the knee-angles for each gait-cycle. When all the steps have been brought to the same length, the mean and standard devation can be determined easily.

For more information, please read the Chapter on "Statistics" of my book Hands-on Signal Analysis with Python
- IMPORTANT: Make sure that here you know what you
have to do. What works best for me is to take a sheet of
paper, and to sketch out what has to be done.
Here, you have to generate a matrix, where each row corresponds to one gait-cycle. Then the matrix operationsnp.mean()andnp.std()can be used to simple calculate mean and standard deviation, for each column (i.e. for each point in time). - Figure out interactively how to interpolate the first full gait cycle.
- Generate the matrix of all gait-cycles.
- Calculate mean and standard deviation for each column of this matrix.
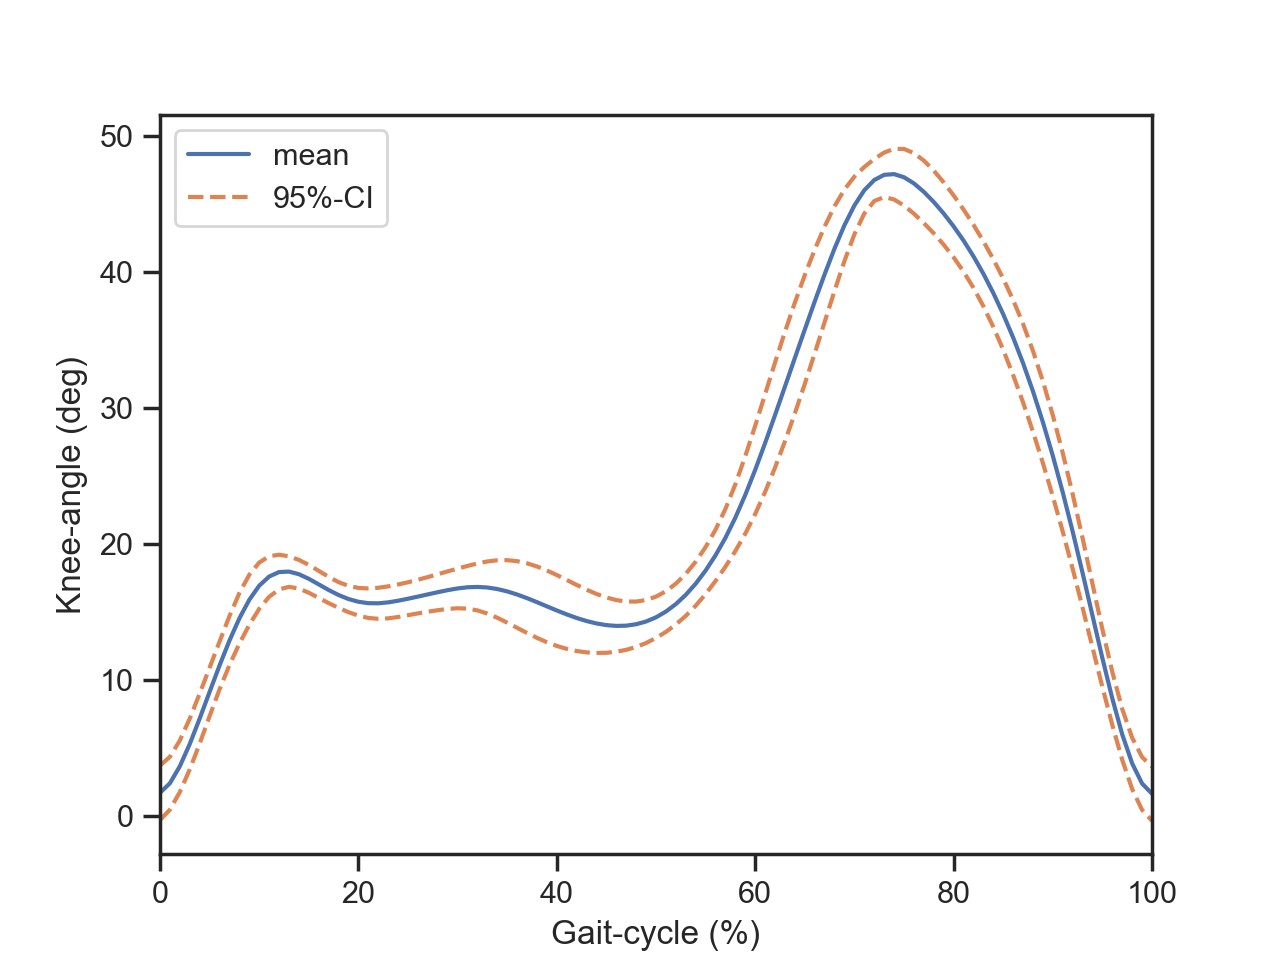
- Generate a plot showing the gait cycle, as indicated above. (The 95% confidence interval corresponds approximately to +/- 2 standard deviations.)

