viewer
Interactive analysis of time-series data.
Interactively analyze time-series data ...
... even with small windows sizes.
Details
Interactive viewer for time-series data. Replaces the older “ui.viewer”. Although it is a user interface utility, it is large enough to make up its own module.
- Variable types that can in principle be plotted are:
- np.ndarray
- pd.core.frame.DataFrame
- pd.core.series.Series
Viewer can be used to inspect a single variable, or to select one from the current workspace.
- Notable aspects:
- Based on Tkinter, to ensure that it runs on all Python installations.
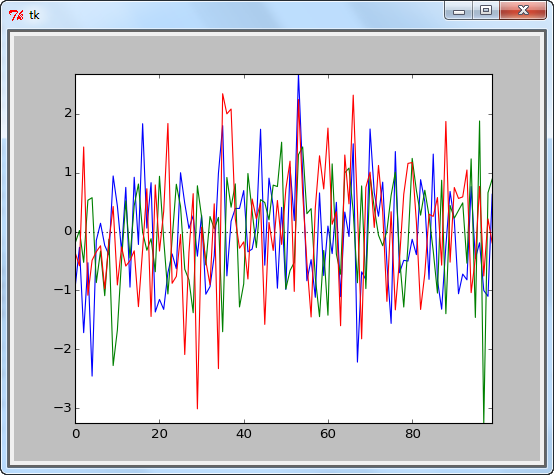
- Resizable window.
- Keyboard-based interaction.
- Logging of marked events.
-
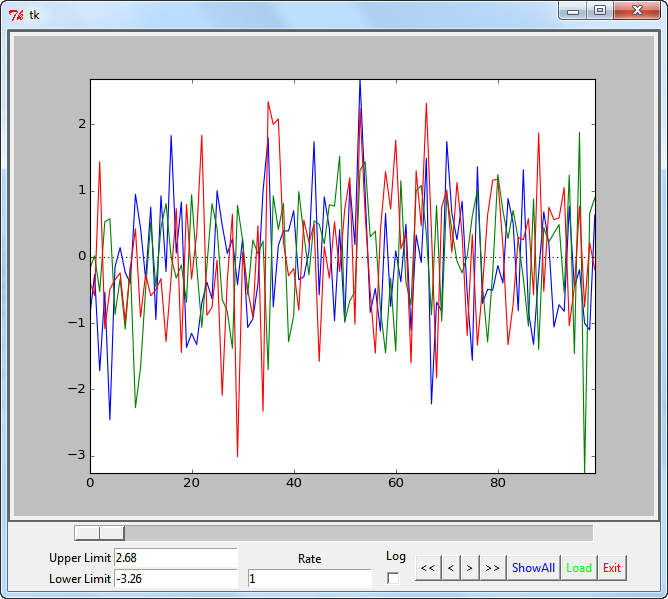
viewer.ts(data=None)[source]¶ Show the given time-series data. In addition to the (obvious) GUI-interactions, the following options are available:
- Keyboard interaction:
- f ... forward (+ 1/2 frame)
- n ... next (+ 1 frame)
- b ... back ( -1/2 frame)
- p ... previous (-1 frame)
- z ... zoom (x-frame = 10% of total length)
- a ... all (adjust x- and y-limits)
- x ... exit
- Optimized y-scale:
- Often one wants to see data symmetrically about the zero-axis. To facilitate this display, adjusting the “Upper Limit” automatically sets the lower limit to the corresponding negative value.
- Logging:
- When “Log” is activated, right-mouse clicks are indicated with vertical bars, and the corresponding x-values are stored into the users home-directory, in the file “[varName].log”. Since the name of the first value is unknown the first events are stored into “data.log”.
- Load:
Pushing the “Load”-button shows you all the plottable variables in your namespace. Plottable variables are:
- ndarrays
- Pandas DataFrames
- Pandas Series
- Examples:
- To view a single plottable variable:
>>> x = np.random.randn(100,3)
>>> viewer.ts(x)
To select a plottable variable from the workspace>>> x = np.random.randn(100,3) >>> t = np.arange(0,10,0.1) >>> y = np.sin(x) >>> viewer.ts(locals)